Block multiverse visualizations
The examples shown in this page are from the Python implementation of loom
The “block multiverse” interface visualizes the probability mass distribution of the future multiverse predicted by a language model conditioned on a prompt.
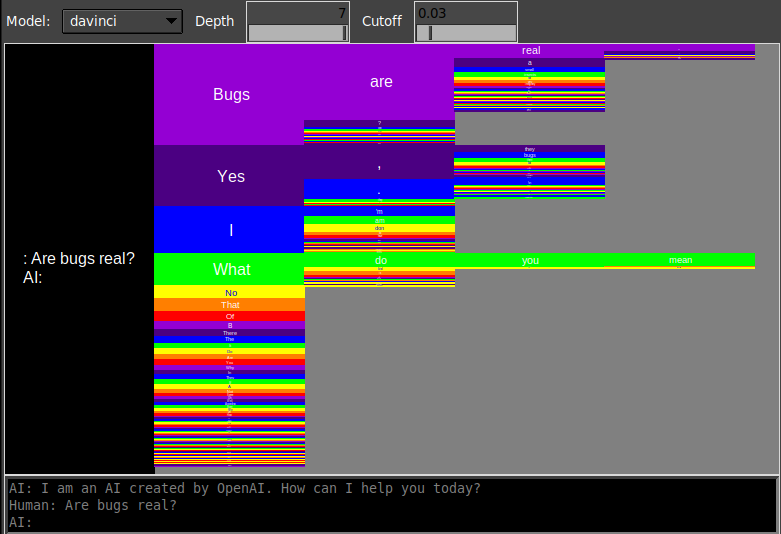
Each block corresponds to a possible sequence ending with the token that is displayed in the block. The x-axis is the sequence dimension, or “time”. Each block’s height indicates the probability that the associated sequence is sampled conditional on the initial prompt (on temperature 1). For instance, if P(A|prompt) = 0.5, and P(B|prompt+A) = 0.3, then the probability of the entire sequence P(A+B|prompt) = 0.5*0.3 = 0.15.
The height of the entire block multiverse is unity (1).
Generation parameters
Depth: this controls the maximum length of sequences to plot.
Cutoff: sequences with total probability less than the cutoff value will not have their future multiverse plotted (to prevent too many calls to the API).
Renormalization
If you click on any of the blocks, the interface will zoom in such that the height of the block equals the height of the display.
Think of this as renormalizing the probabilities so that the block in question now has a probability of unity (1). Now we’re visualizing probabilities conditional on the sequence associated with the renormalized block, equivalent to assuming that it was in fact sampled.
 The bottom of the screen displays the change in magnification and total magnification after each zoom